make me a linked open data story
MELODY is a place where you can make sense of Linked Open Data and publish beautiful data stories.
About melody
When you work with Linked Open Data, you often want to have a quick overview of what is in your data. Get some figure from a query, maybe plot a chart, make a comment, and share what you found with others. Right?
With MELODY (Make mE a Linked Open Data storY) you can do it, and you can do it easily! MELODY is a What-you-see-is-what-you-get (WYSIWYG) dashboard that allows you to transform SPARQL queries into beautiful charts. For instance, a query can return a bar chart, a map, or it can trigger a text search. Results of the text search can be attached to other searches, and so on.

You can choose among several components for presenting your data! whether you need to present statistics, explore a map or create an interactive follow-your-nose interface, MELODY comes to the rescue!

When you are happy with your result, you can export your story as a PDF, as a static web-ready document, or you can publish it here, in our online catalogue.
our components
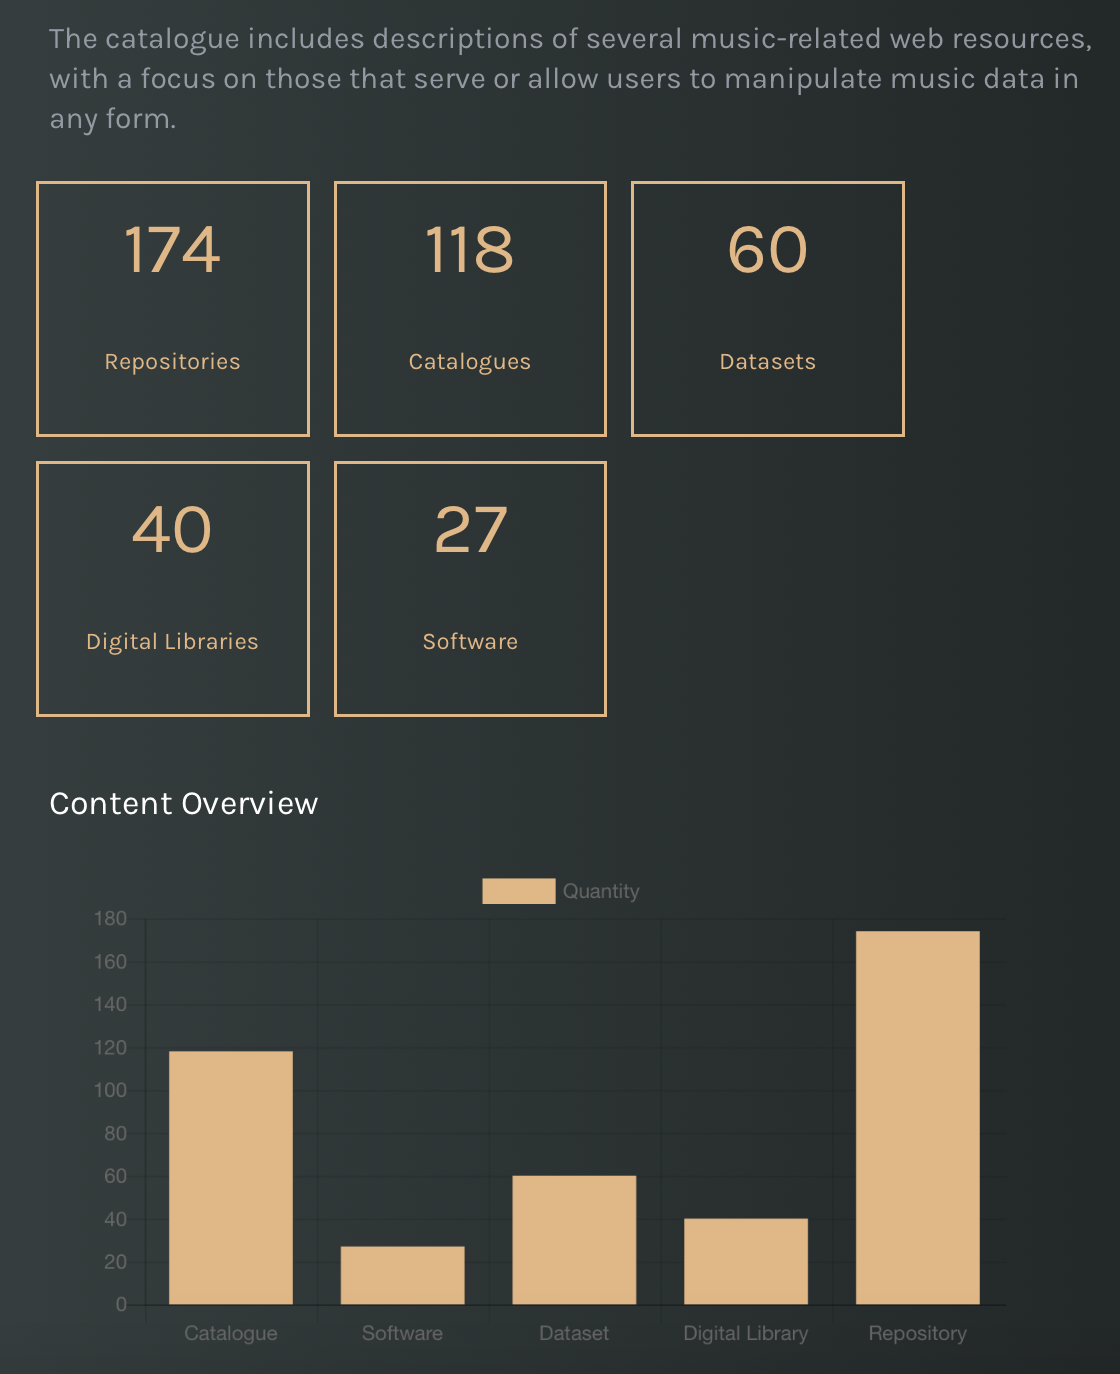
A visual presentation of a dataset with charts, plots, and your curated text.
Use counters, bar charts, line charts, doughnuts and scatterplots to present your dataset. Organise the presentation in sections and add your comments to accompany charts.
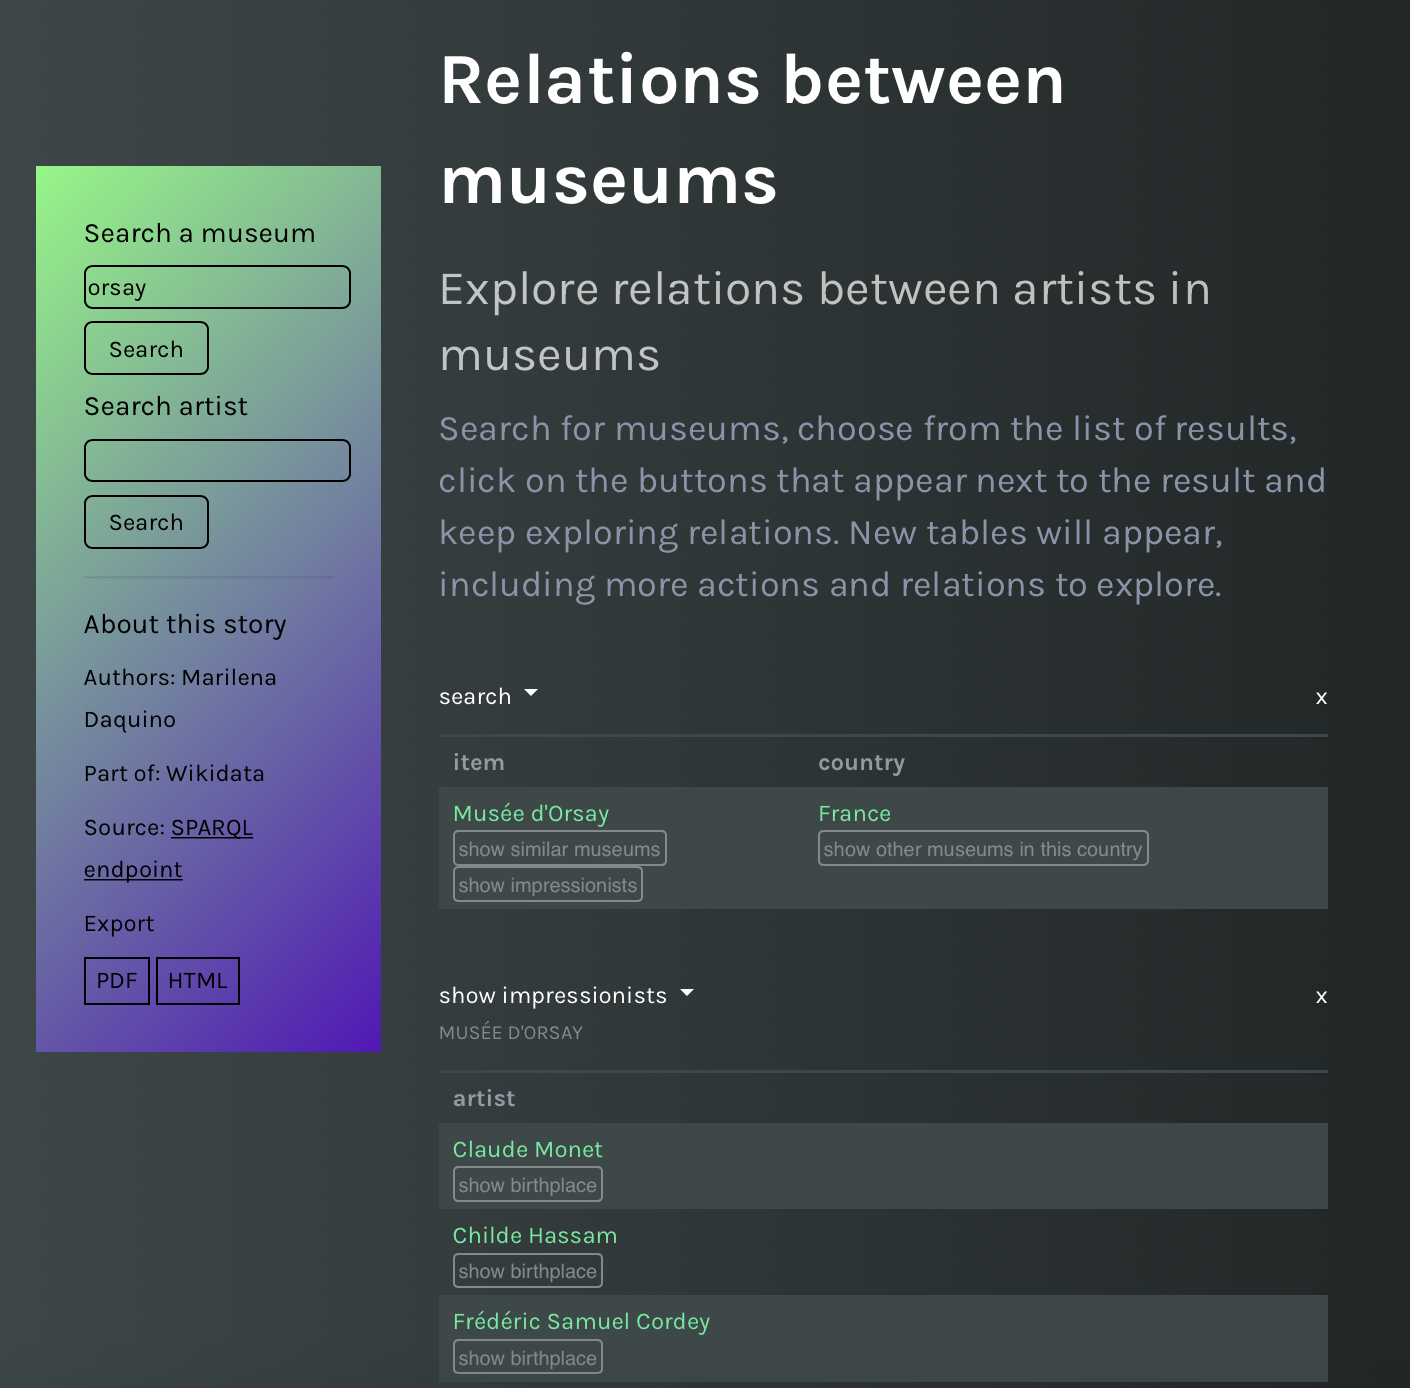
An interactive text search and an easy way to discover new relations between your data.
Search contents, show results as tables, and enable actions on results, e.g. make new searches or combine results of different searches. Build the story line of your searches.
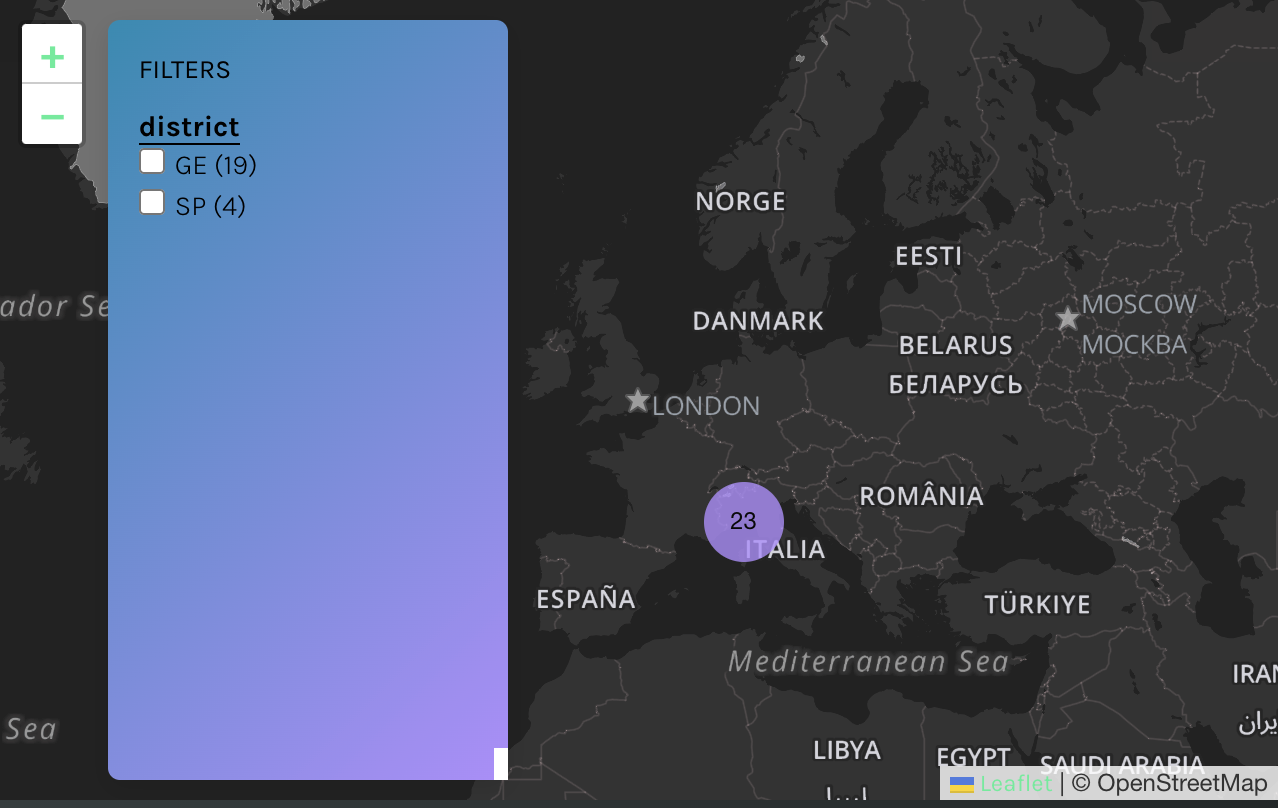
An interactive map to frame your data in space.
Plot data points on a map, create filters and browse details in highly customisable siderbars.
Get started
- know where your Linked Open Data are the URL of an endpoint
- know how to query your data SPARQL!
- a personal github account to publish your data story (optional)
- know what story you want to tell us get inspired with some examples
To start creating data stories with MELODY you need a few things. But no, you don't need to code!
browse data stories
Anybody can publish a story with MELODY. Here you will find the latest data stories created by our users.